


This article is an excerpt from our Cryptocurrency Geography 2025 report. Download the full report now!
APAC’s Top Crypto Markets: Distinct Paths from India to Japan
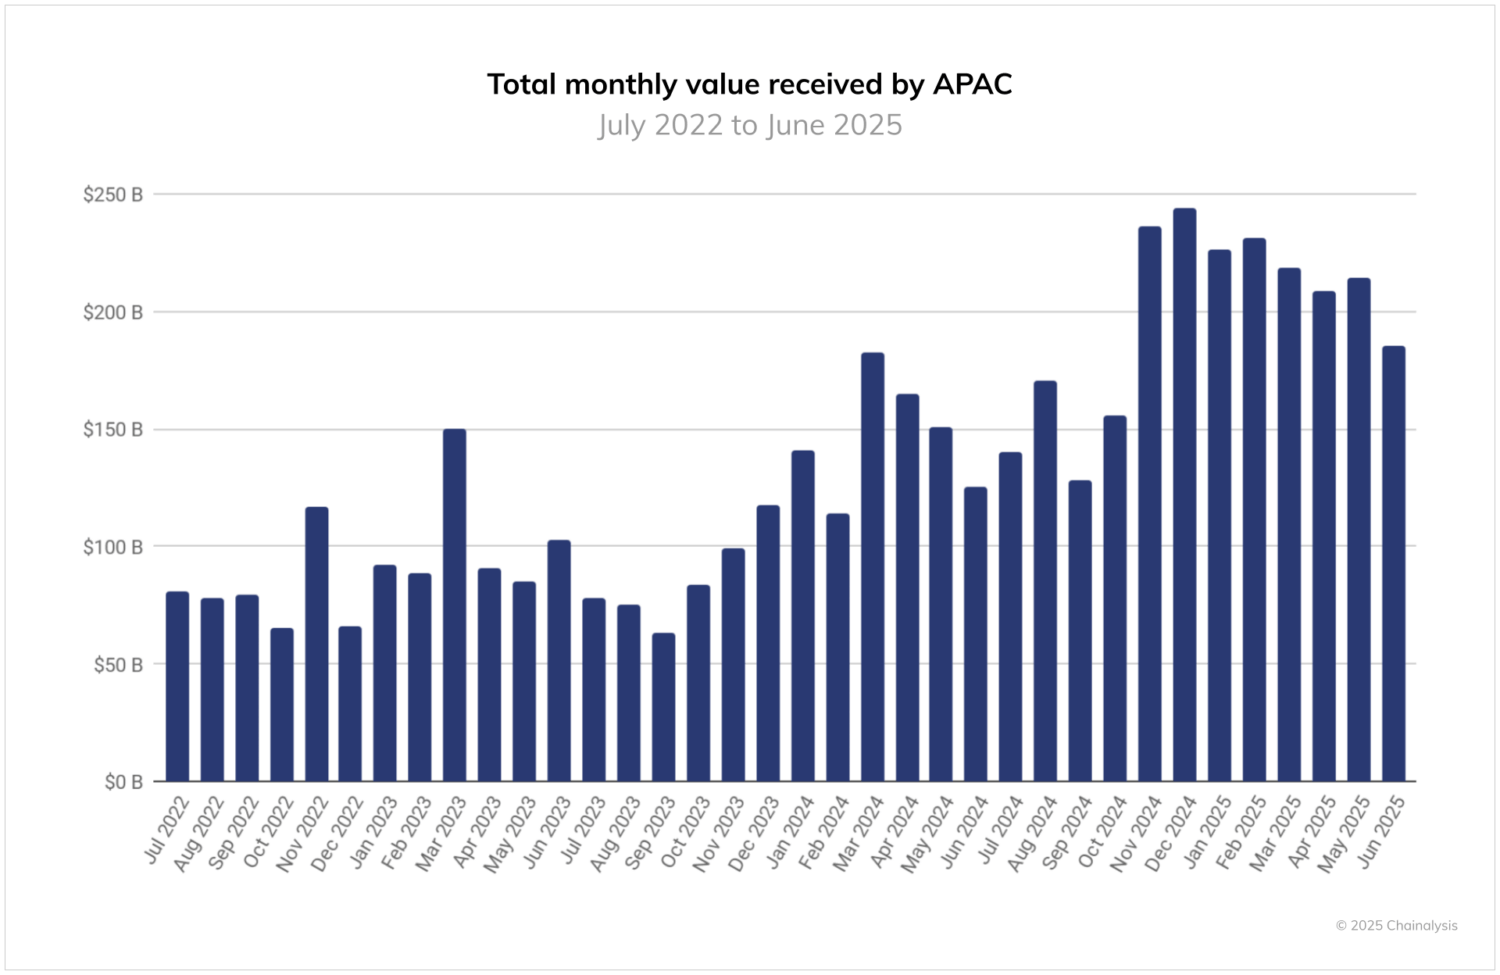
From July 2022 to June 2025, APAC demonstrated strong growth in cryptocurrency activity, with estimated on-chain transaction values showing a clear upward trajectory. Monthly value received on-chain increased from approximately $81 billion in July 2022 to a peak of $244 billion in December 2024, a three-fold increase over 30 months.
Notable growth periods include:
- In late 2023 and early 2024, monthly value received on-chain crossed the $100 billion mark for the first time as cryptocurrency markets recovered.
- The fourth quarter of 2024 marked the highest on-chain value in the region, driven by strong year-end numbers in November and December as global markets surged following the US presidential election.
- Although volumes have since declined from their peak in December 2024, the value received on-chain remains relatively high, above $185 billion per month through mid-2025.
As the fastest growing region in the world in terms of on-chain value received, APAC has become a key growth engine globally, often ranking second behind Europe in volumes and sometimes surpassing North America in monthly totals. The data reflects APAC’s growing influence in global markets and its sustained momentum through the second half of 2025.
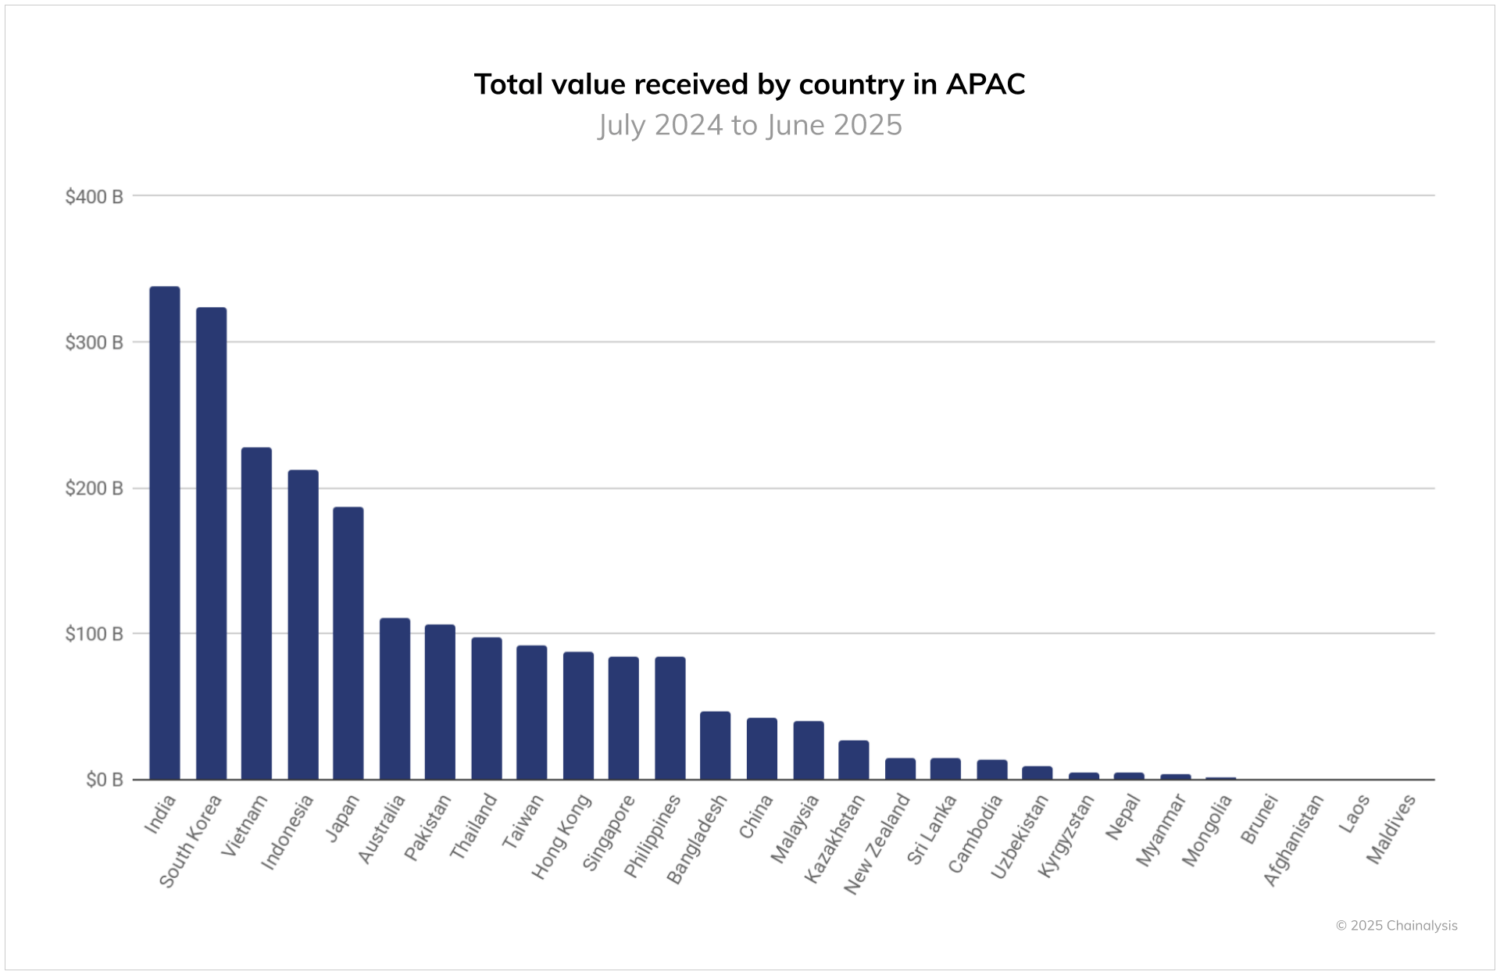
In APAC, major markets show strikingly different paths to crypto. India, the largest country at $338 billion, combines popular adoption with structural financing gaps: a large diaspora has remittance needs, young adults use cryptocurrency trading as a complement. incomeand fintech rails like UPI and eRupi are accelerating usage.
According to experts in the field, use cases for cryptocurrencies vary across markets. In South Korea, the second-largest APAC market by value received, cryptocurrencies trade almost like stocks – liquid, speculative and traditional – while new rules like Virtual Asset User Protection Act of 2024 are reshaping activity on the main national stock exchanges. Vietnam, in third place, presents crypto as an everyday infrastructure for remittances, gaming and savings. Pakistan adds a fourth archetype: With a young, mobile population and $35 billion in remittances, stablecoins are used to hedge inflation and freelancers are paid in crypto, aided by a government now signaling regulation rather than restriction.
Smaller markets reveal other dynamics. Australia is taking action by modernizing its AML/CFT regime, cleaning up inactive digital foreign exchange licenses and bringing clearer oversight to the sector, laying the foundations for a more mature market. Singapore and Hong Kong continue to benefit from strong policy momentum, with regulators continuing to emphasize strict standards as a means of creating a digital asset platform.
Japan’s Crypto Momentum Fueled by Regulatory Changes
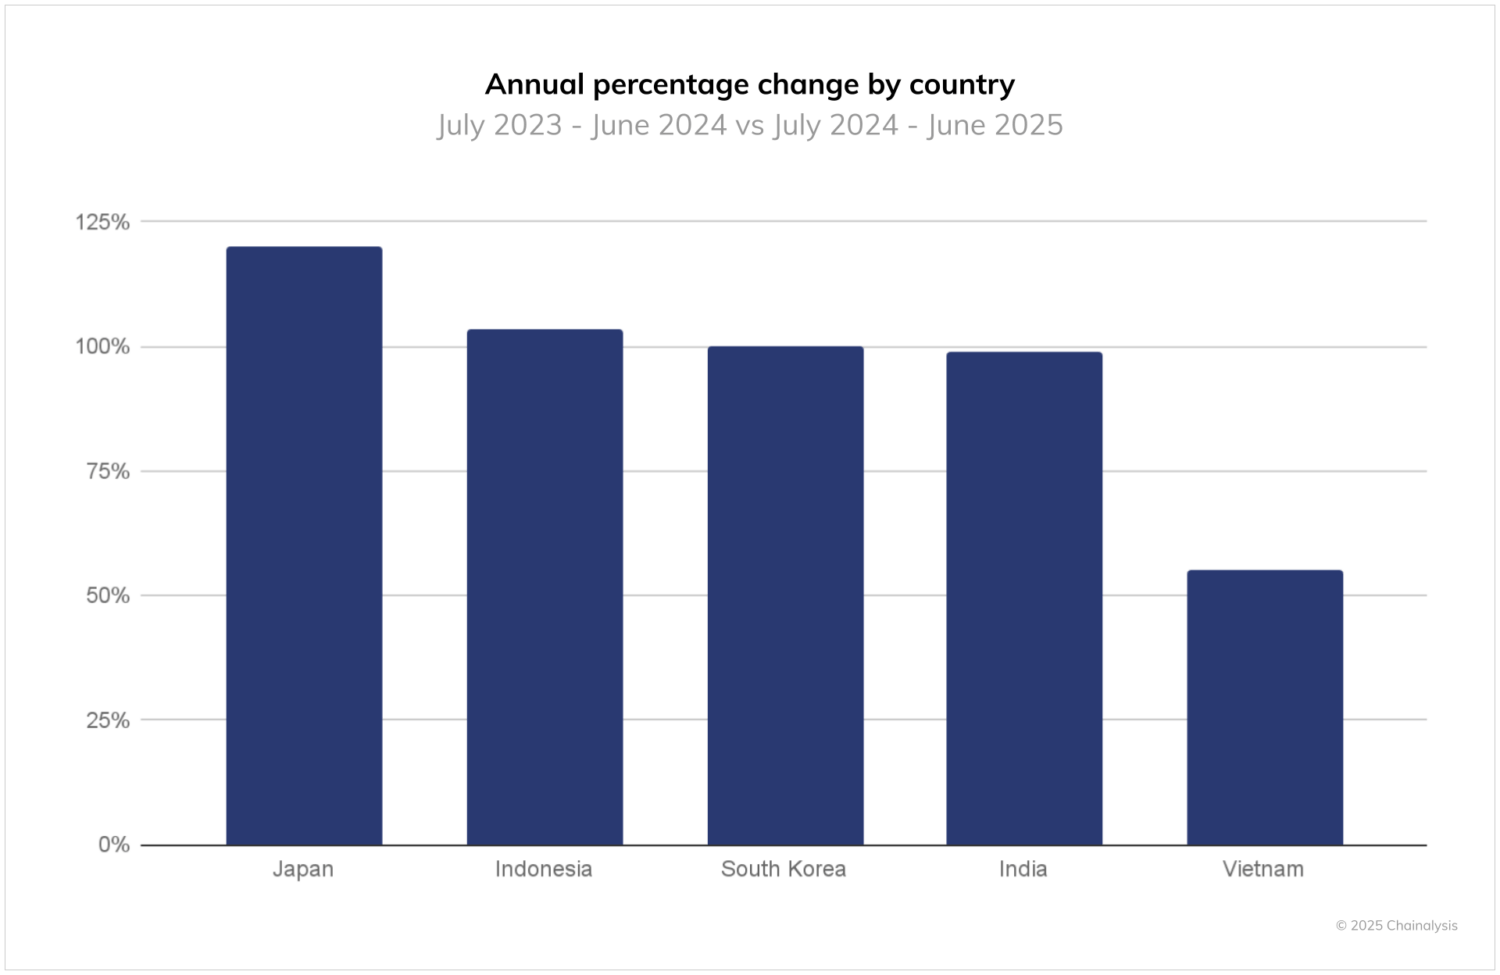
Among the top five APAC markets, Japan saw the highest growth. Value received on-chain increased 120% in the 12 months to June 2025 compared to the previous 12 months, surpassing Indonesia (103%), South Korea (100%), India (99%) and Vietnam (55%). The Japanese market has been relatively sluggish in recent years compared to its neighbors, and the latest growth comes amid several policy developments that will support market growth over time (including regulatory reforms to better take into account the role of crypto as an investment instrument, planned changes the tax regime for cryptocurrencies and the granting of licenses to the first issuer of yen-backed stablecoins).
In contrast, growth in India, South Korea and Indonesia reflects continued expansion, but from already high baselines, while the lower figure of 55% in Vietnam suggests a maturing market where crypto is already deeply embedded in remittances and everyday financial activity.
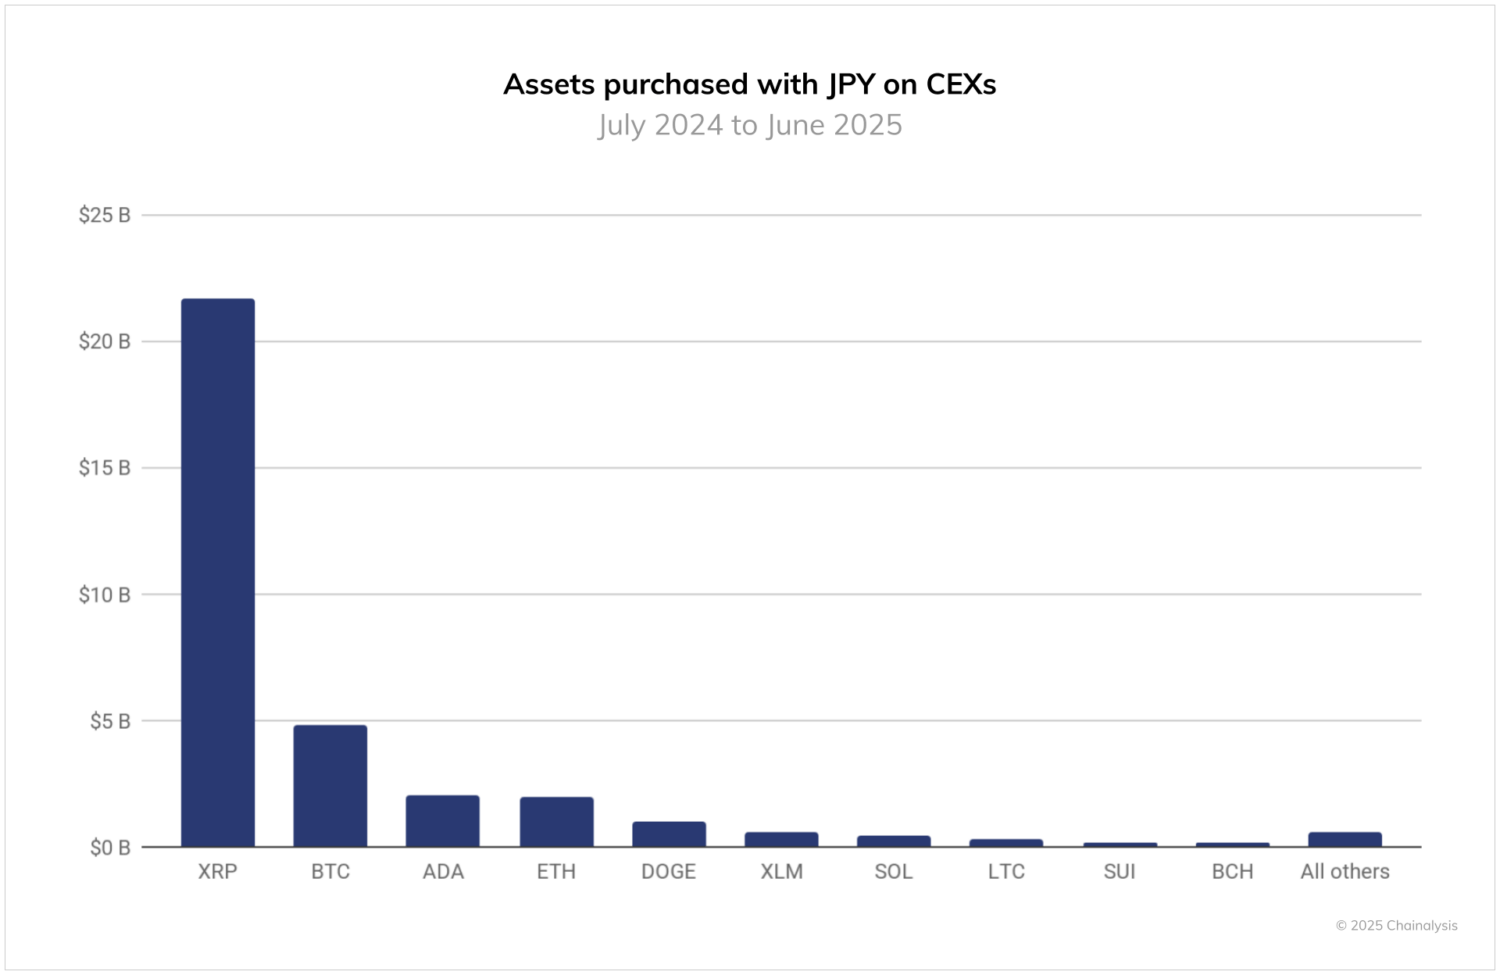
Japan’s growth follows significant advances in its crypto industry. For some time now, regulatory restrictions have limited the listing of stablecoins on national exchanges, although this is NOW beginning to change. Instead, in the 12 months through June 2025, purchases of cryptocurrencies using JPY were primarily funneled into XRP, which accounted for $21.7 billion in fiat trading activity, BTC ($4.7 billion), and ADA ($2.0 billion).* strategic partnership with SBI Holdings. Going forward, markets will carefully watch how stablecoins such as USDC and JPYC gain traction.
South Korean market driven by professional traders and stable coin growth
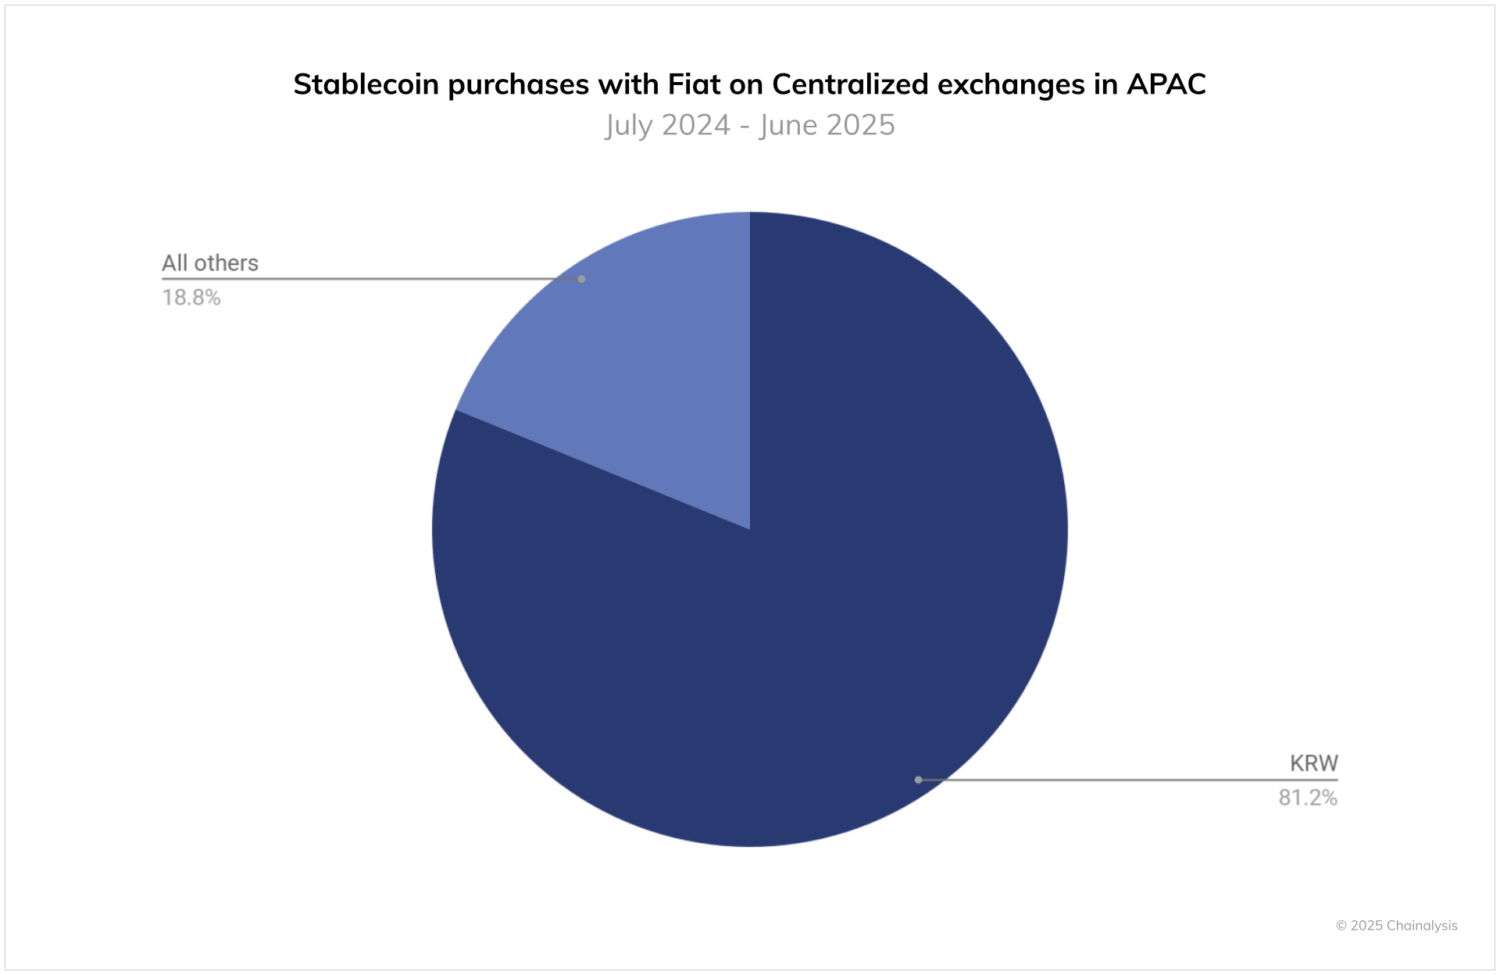
Stablecoin usage in South Korea is growing rapidly, with major exchanges like Bithumb and Coinone adding USDT/KRW pairs starting in December 2023. KRW purchases of stablecoins reached $64 billion in the 12 months to June 2025, suggesting strong demand from traders who use them for liquidity, hedging and faster turnovers between assets.* The domestic appetite for stablecoins is impacting the policy landscape, with lawmakers and regulators now considering the development of a regulatory framework for KRW-backed stablecoins.
While current discussions are largely focused on the issuance of stablecoins by banks and regulated financial institutions, the focus solely on issuance leaves significant gaps: there is little debate about how stablecoins will be distributed, listed on exchanges, or traded on secondary markets. This oversight is particularly striking in Korea, where KRW-denominated stablecoins already represent by far the largest business in the Asia-Pacific region – around $65 billion, compared to just $9.4 billion in THB and smaller volumes in IDR, AUD and HKD.* For stablecoins to continue this adoption in Korea, regulatory clarity will need to extend beyond issuance to cover the entire lifecycle, from distribution and circulation to integration into payment and settlement systems.
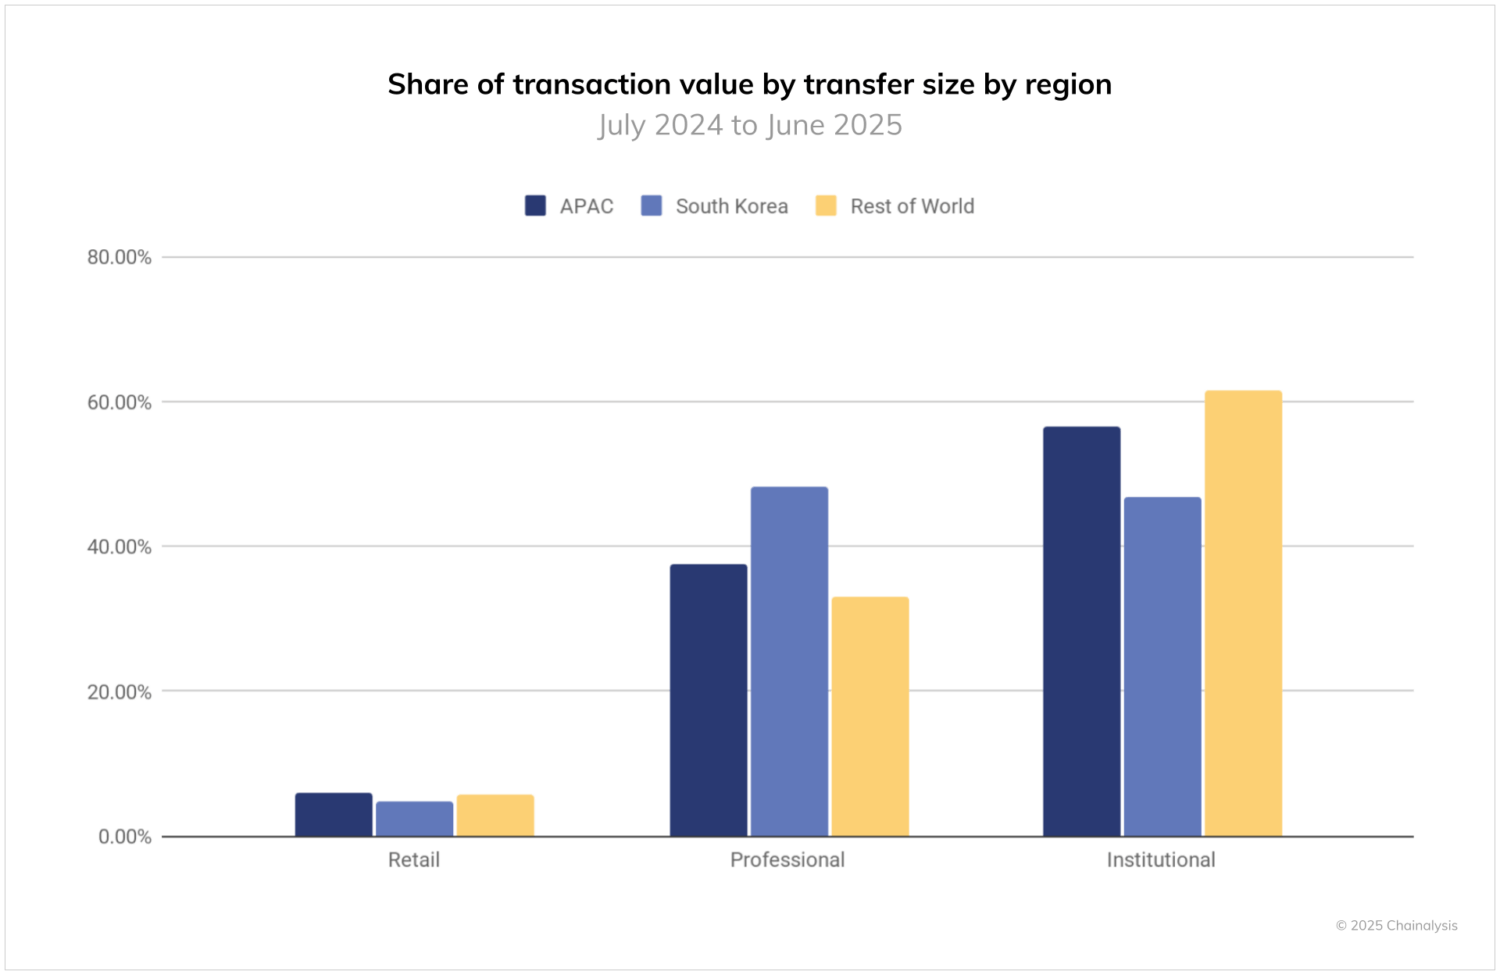
Returning to on-chain trading volumes, the South Korean crypto market sees disproportionate activity in transactions worth between $10,000 and $1 million, which we have designated as “professional” activity. Nearly half of Korea’s on-chain activity is driven by this segment, well above global levels. This reflects a culture of active commerce by users in an advanced economy. While regulations have so far prevented corporate and institutional players from participating in the Korean market, recent regulatory improvements are gradually opening the door to corporate participation, potentially adding diversity to the market.
India tops the index thanks to its local and institutional strength
The Indian crypto market, however, is the undisputed leader in the region in terms of on-chain transaction volume and placement in the Global Adoption Index 2025. Ranking first this year across all sub-indexes, the Indian crypto market is both rapidly growing and highly complex. Organizations such as the Bharat Web3 Association normalize cryptography as a secure and legitimate method of value transfer. At the same time, popular adoption is evident in everyday life, from young students experimenting with blockchain and coding to communities using crypto for small-scale income opportunities.
India’s broader digital economy provides a strong foundation for this growth. The country’s thriving fintech ecosystem, widespread use of UPI payments, and innovations such as eRupi demonstrate India’s ability to adapt to new financial technologies at scale. As regulators and law enforcement collaborate to establish clear frameworks and oversight, the dynamics suggest crypto is becoming an integral part of India’s digital future.
| Rank of India | |
|---|---|
| Overall Index Score | 1 |
| Retail | 1 |
| CeFi | 1 |
| Challenge | 1 |
| Institutional | 1 |
APAC is now one of the most dynamic regions when it comes to global crypto adoption, with countries charting very different but equally impactful paths. From India’s dominance and South Korea’s speculative sophistication to Japan’s adoption of XRP and experiments in smaller markets, the region highlights crypto’s adaptability to diverse economic and cultural contexts. This diversity not only drives adoption, but also positions APAC as a bellwether for how global crypto usage will evolve in the years to come.
*This data was updated on October 21, 2025 to reflect the correction of a previous error. The update did not change the main overall findings.
This website contains links to third party sites that are not under the control of Chainalysis, Inc. or its affiliates (collectively “Chainalysis”). Access to this information does not imply any association, endorsement, approval or recommendation by Chainalysis of the site or its operators, and Chainalysis is not responsible for any products, services or other content hosted there.
This material is provided for informational purposes only and is not intended to provide legal, tax, financial, or investment advice. Recipients should consult their own advisors before making these types of decisions. Chainalysis assumes no responsibility for any decision made or any other act or omission in connection with the recipient’s use of this material.
Chainalysis does not guarantee the accuracy, completeness, timeliness, suitability or validity of the information contained in this report and will not be liable for any claims attributable to errors, omissions or other inaccuracies in any part of this material.